- Templates |
- Gantt chart examples
Gantt chart examples
Twelve editable Gantt chart examples, grouped by the kind of project they plan. Each one is a working chart with its phases, dependencies and milestones already in place, and the note under it tells you what to look at. Open any example in the browser, or copy it into a free account and change the dates to yours.
- 12 examples
- 6 kinds of project
- Published September 24, 2026
If you have never read one before, how a Gantt chart works covers the bars, links and milestones first. Otherwise, scroll to the project closest to yours.
Gantt chart examples for everyday project management
Four charts that fit most projects, from a single week to a four-month schedule. They differ mostly in how much detail they show and who they are for.
Project schedule
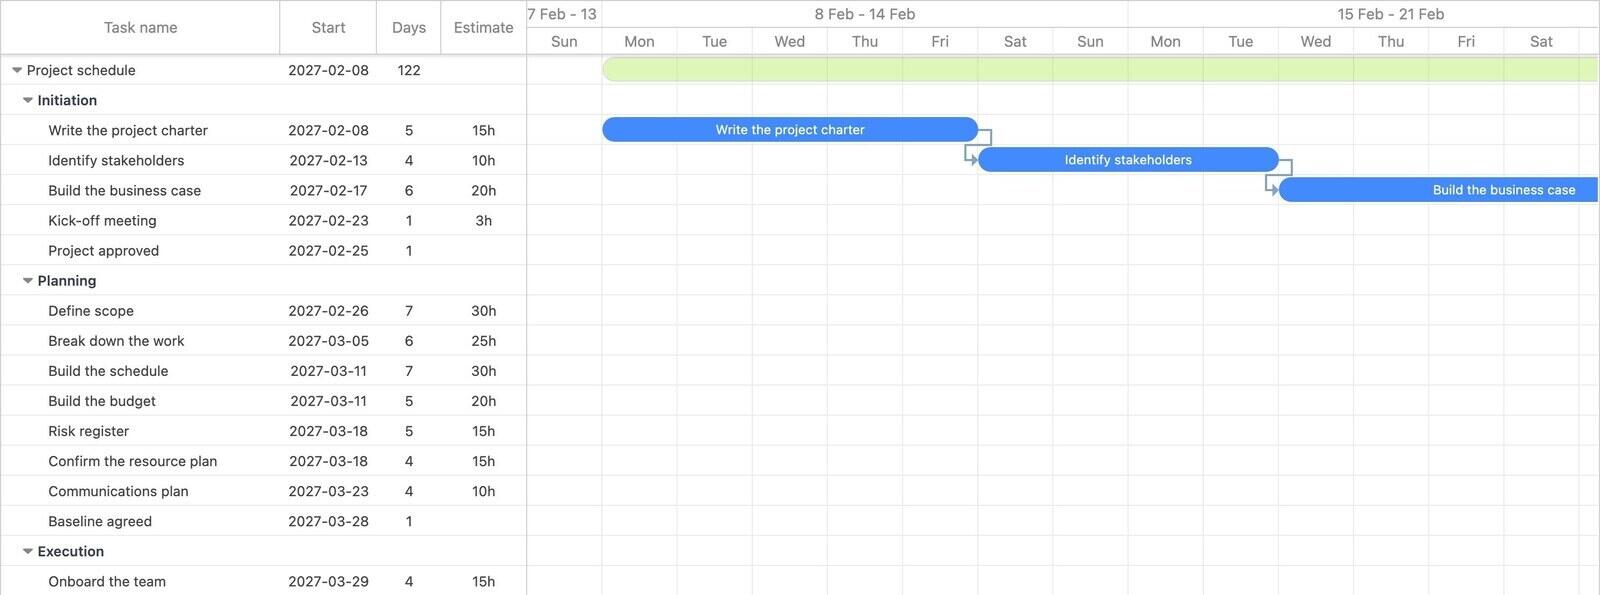
Five phases from initiation to closure, with two workstreams running side by side in execution and joining at integration. Notice the two long bars under monitoring and control: status reporting and change control run alongside the delivery work, not after it. The Baseline agreed milestone is the point where the plan stops being a draft. What each phase covers.
Simple Gantt chart
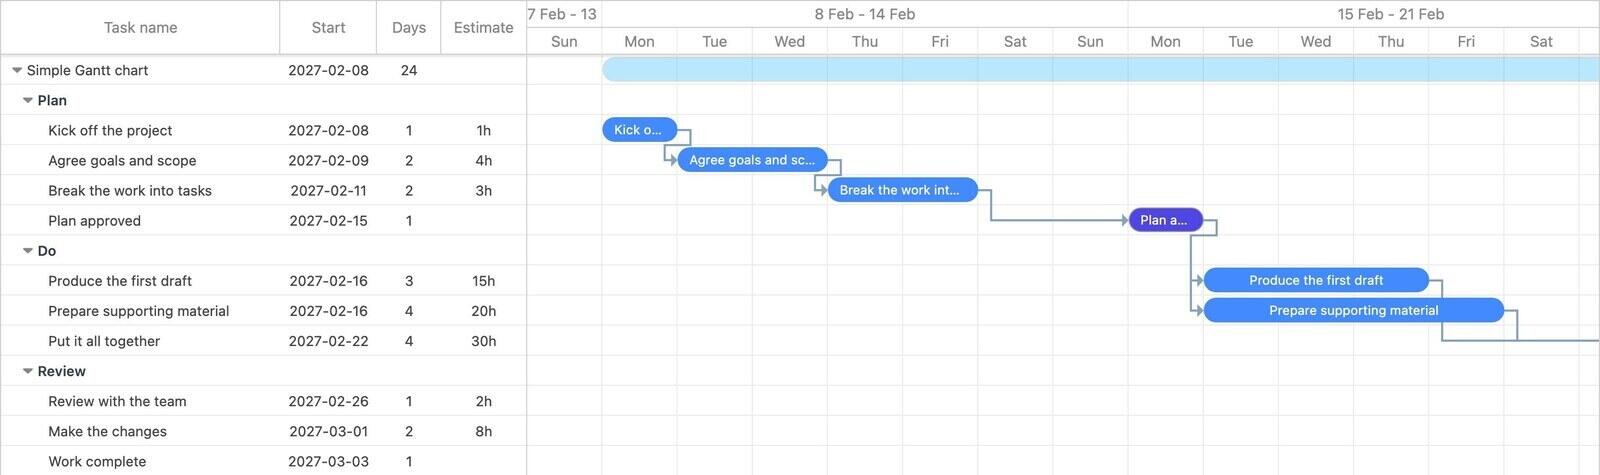
Three phases, eight tasks and two milestones across about four weeks. The shape worth noticing is in the middle: after Plan approved, two tasks start on the same day, and both have to finish before Put it all together can begin. That fork and join is a common dependency pattern, and the small version shows it without clutter.
Project timeline
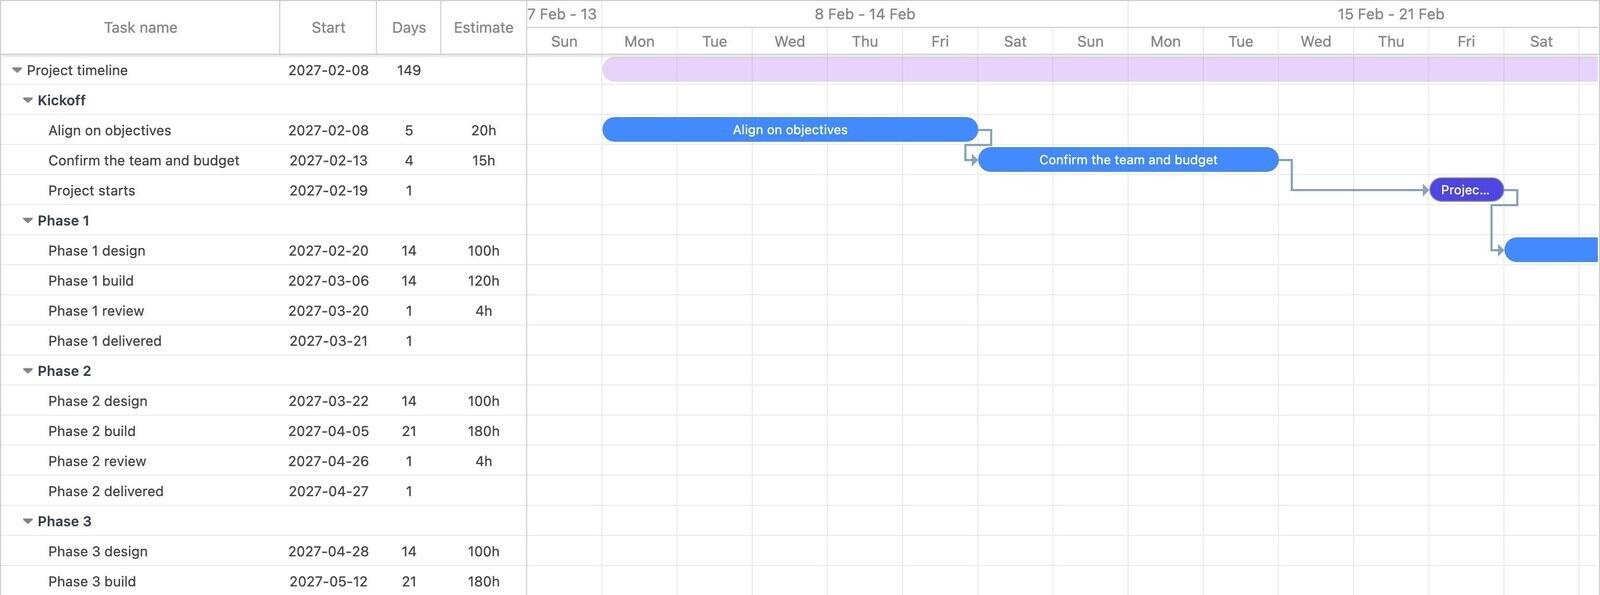
Made for people who are not doing the work. Each delivery phase is a design, build and review sequence, there are six milestones in five months, and task detail is left out on purpose. Every phase ends with a short review before its Delivered marker, so a milestone on this chart means someone has looked at the work. It suits a client or board update better than day-to-day running.
Weekly project plan
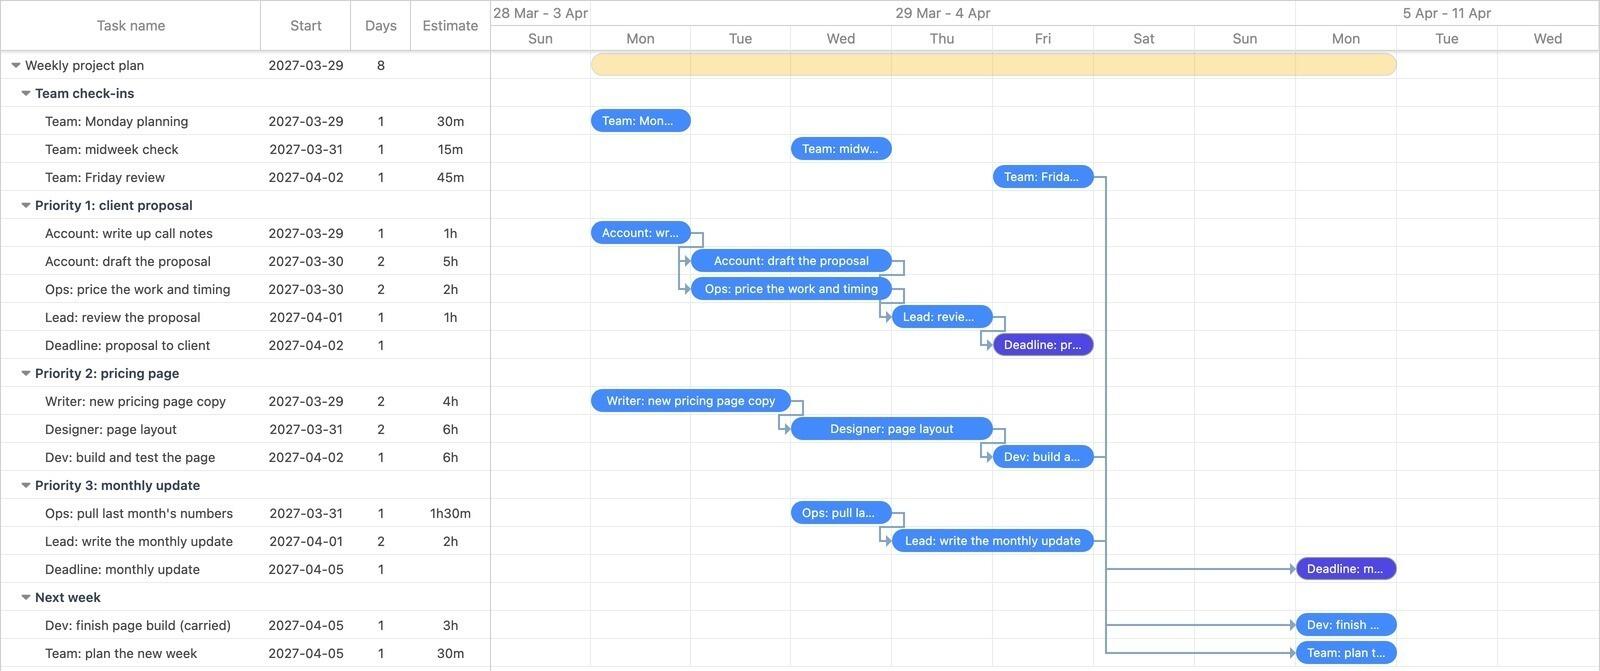
One team's working week. The three priorities are the groups, each task starts with the role that owns it, and the week has a Monday planning slot, a Wednesday check and a Friday review. The two milestones are the only dates promised outside the team; every bar is an estimate that can move. The last group shows one unfinished task carried into next week by hand, linked back to the bar it came from. More on running the week from it.
What does a construction Gantt chart look like?
Long chains of work that cannot start early, and waits for permits and inspections that nobody on site controls.
Construction schedule
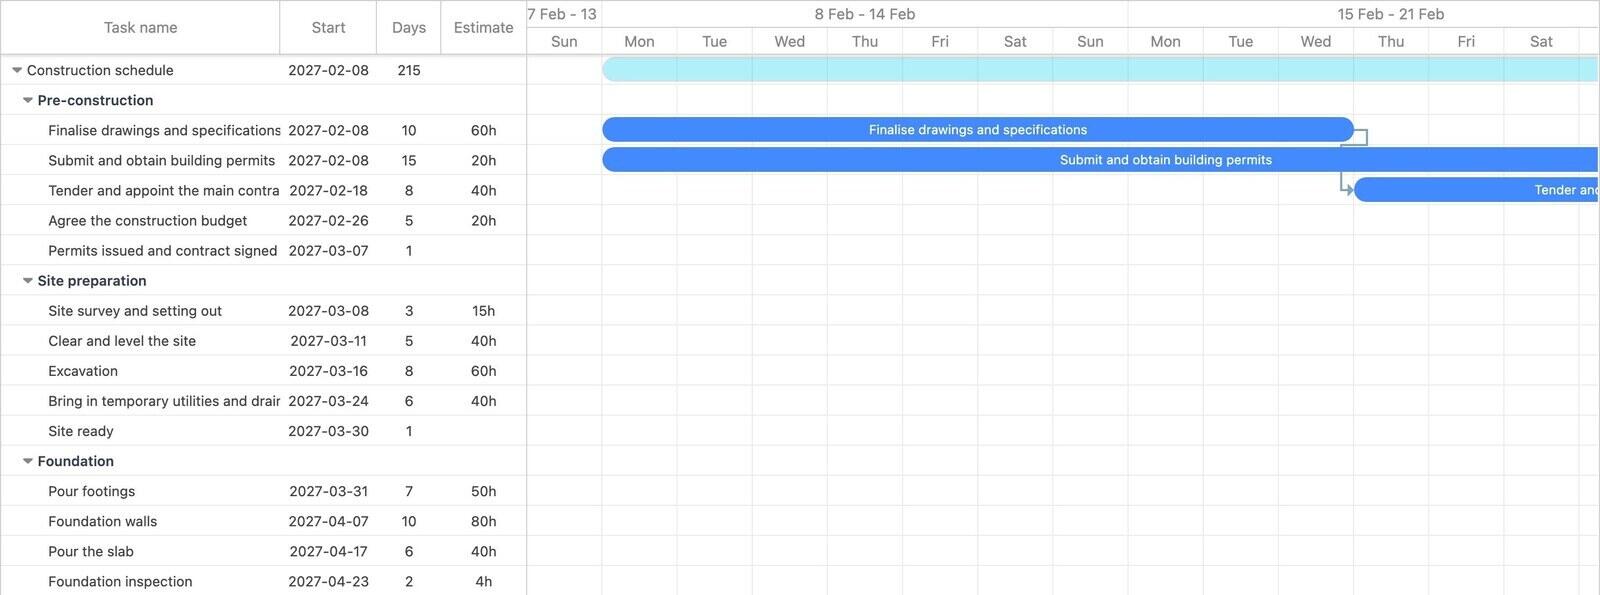
Seven phases from the permit application to practical completion, over about seven months. Almost nothing starts early: framing waits for the foundation sign-off, and insulation waits for the rough-in inspection. The one burst of parallel work is the first fix, where electrical, plumbing and HVAC each get their own bar so you can see which trade is holding up the inspection. Look at the permits bar too, which starts on day one because it is the wait you least control. Weather and inspection allowances are covered on its own page.
Which example suits a research proposal or dissertation?
Academic plans are shaped by approvals and feedback queues more than by the research itself.
Research project plan
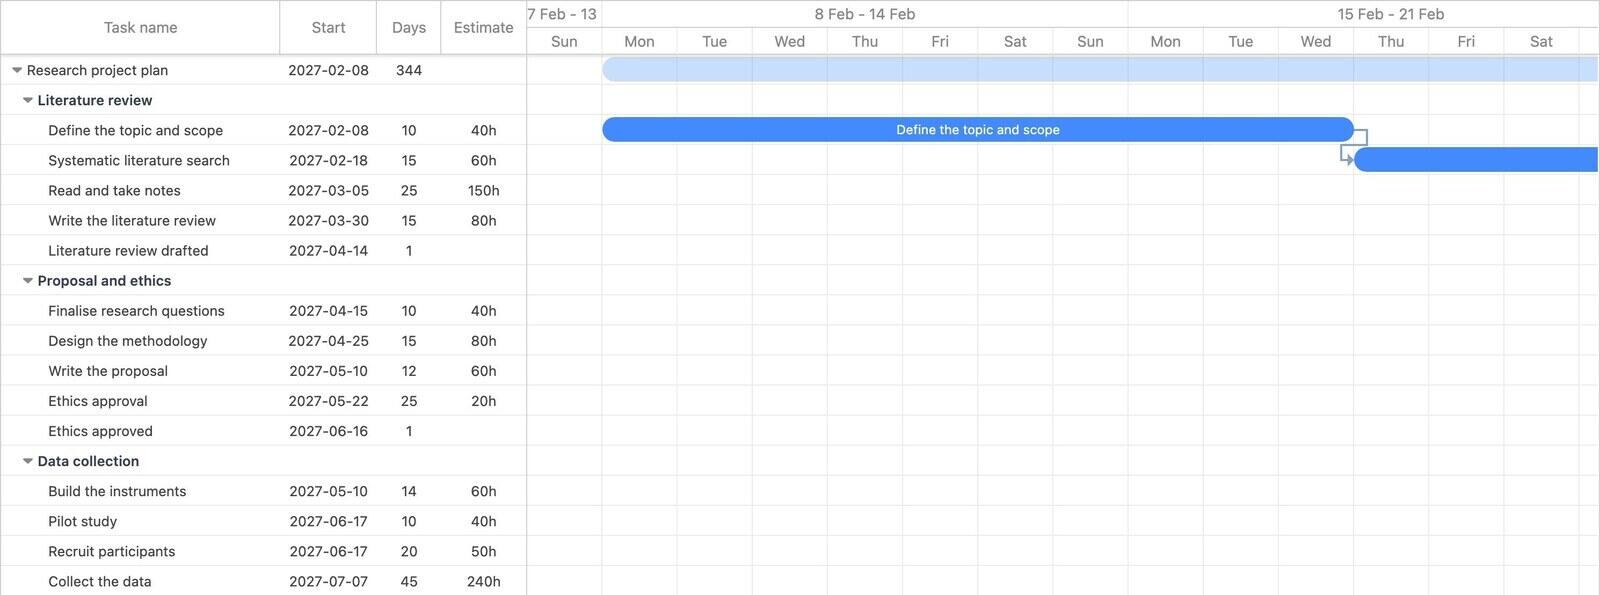
Eleven months from the literature review to submission. Two bars matter more than the rest: ethics approval, a five-week wait that nothing in the field can start before, and supervisor review near the end. Notice what happens around them. The data collection instruments are ready before ethics approval comes back, so fieldwork can start the day it clears, and the methods chapter is drafted while the analysis runs. There are notes on stretching it to a PhD.
Gantt chart examples for marketing, launches and events
Three plans that work back from a fixed date: the day the campaign goes live, the day the product ships, the day the doors open.
Marketing campaign plan
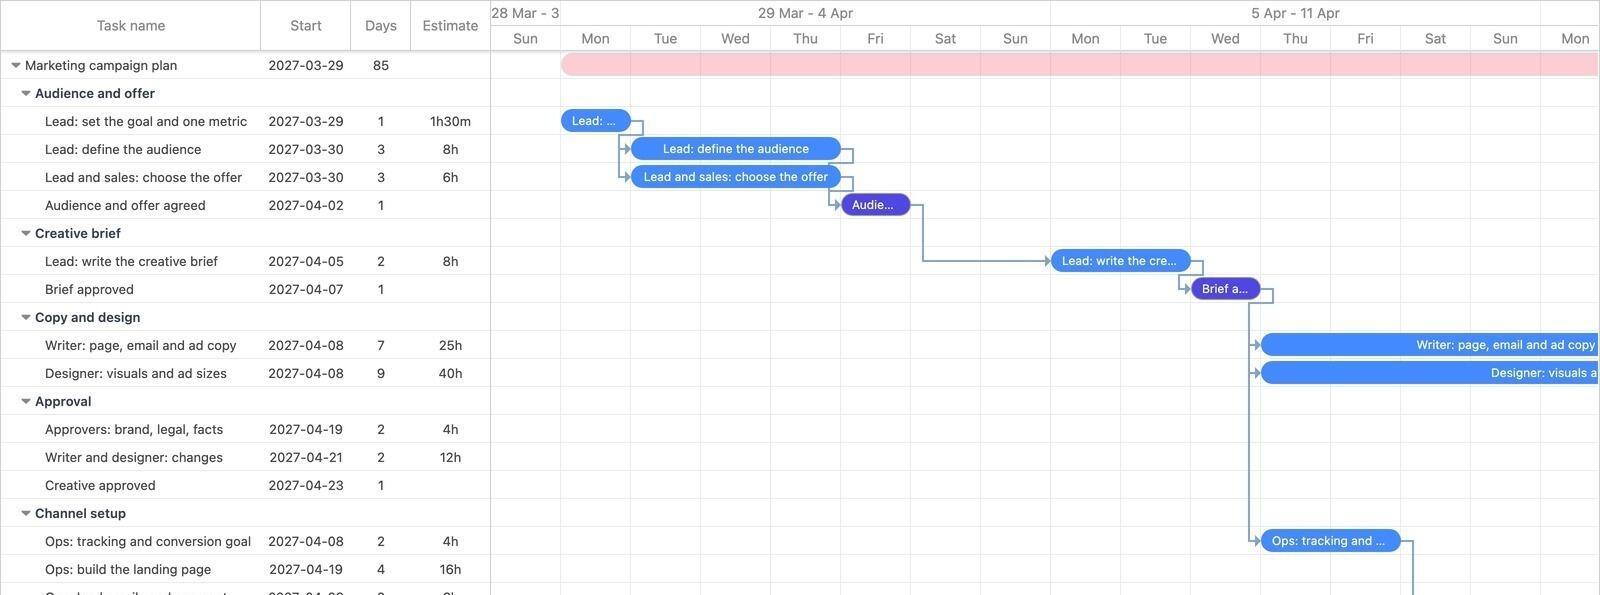
A six-week campaign with the preparation in front of it: audience and offer, a creative brief, copy and design side by side, an approval round, then channel setup. Four milestones stand between the first idea and launch day, one of them the creative approval, and the testing task waits for the landing page, the emails and the ads together. Once the campaign is live, ads and organic posts run as long bars with a mid-campaign review and an ad refresh inside them. Its own page explains the two-week version.
Product launch plan
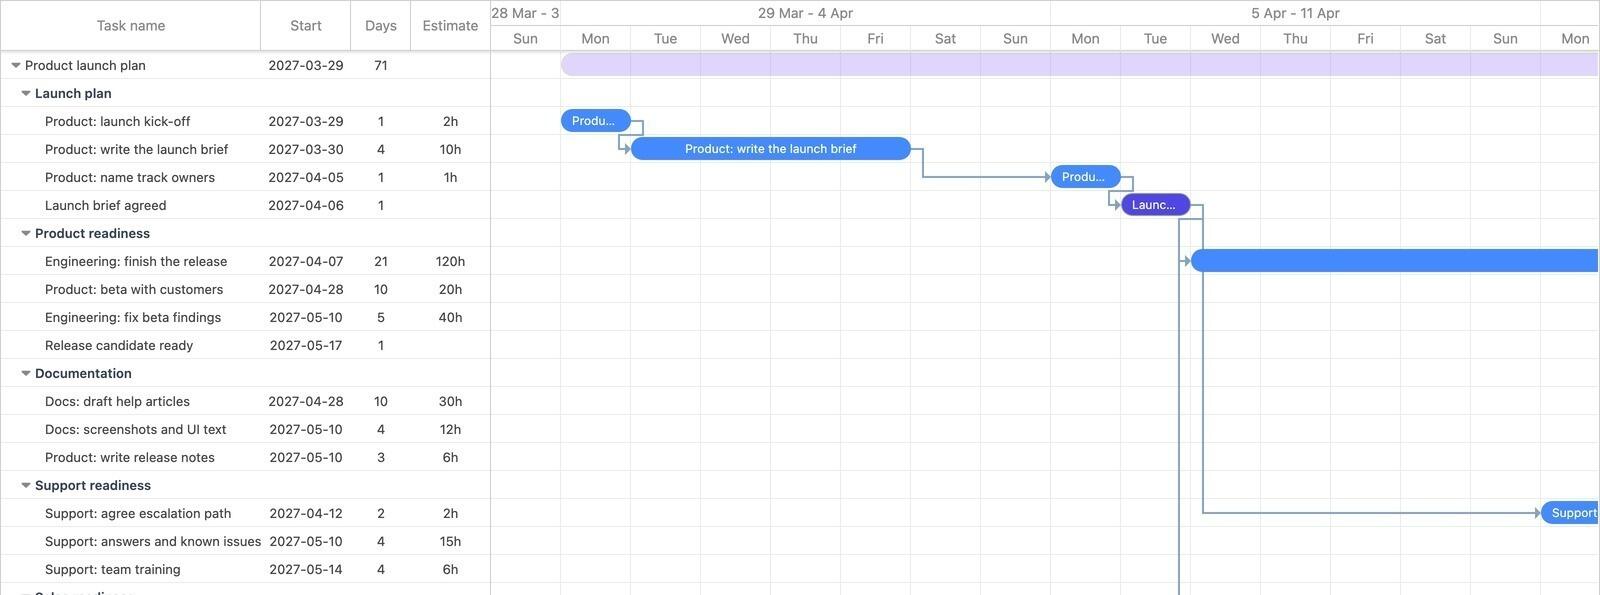
Built around readiness rather than the build. Product, documentation, support, sales and a marketing handoff each get their own group, and every one of them feeds a single readiness review and a go/no-go decision. The six arrows into that review are the prerequisites that move if the launch date moves. A post-launch review closes the plan two weeks after launch day. See what a date change affects.
Event plan
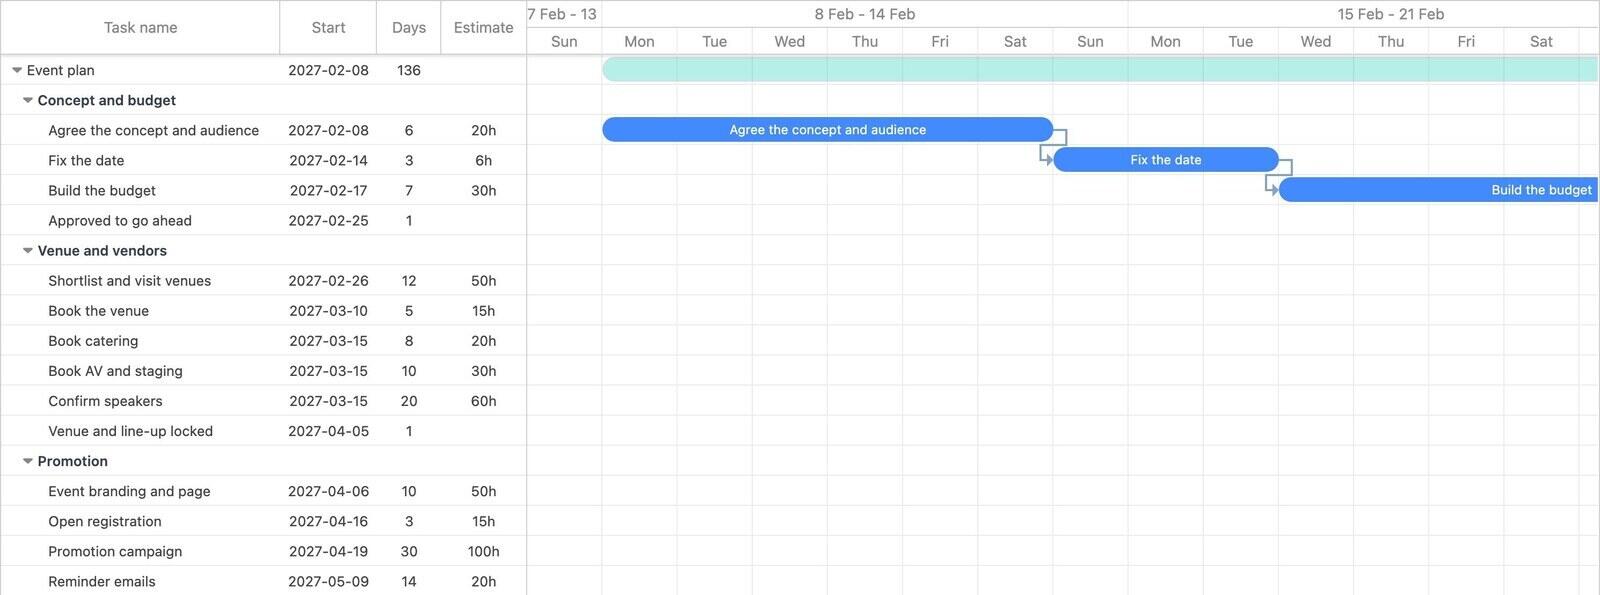
Everything works back from the date on the invitation. The venue booking is the gate: catering, AV and speakers only open up once it is done, then run in parallel until the venue and line-up are locked. The wrap-up phase after the event, with the survey, the thank-you emails and the vendor invoices, is the part most event plans forget. The event page explains why the venue comes first.
Which examples fit software projects and roadmaps?
One software project with a defined scope, and one chart for seeing several projects at once.
Software development plan
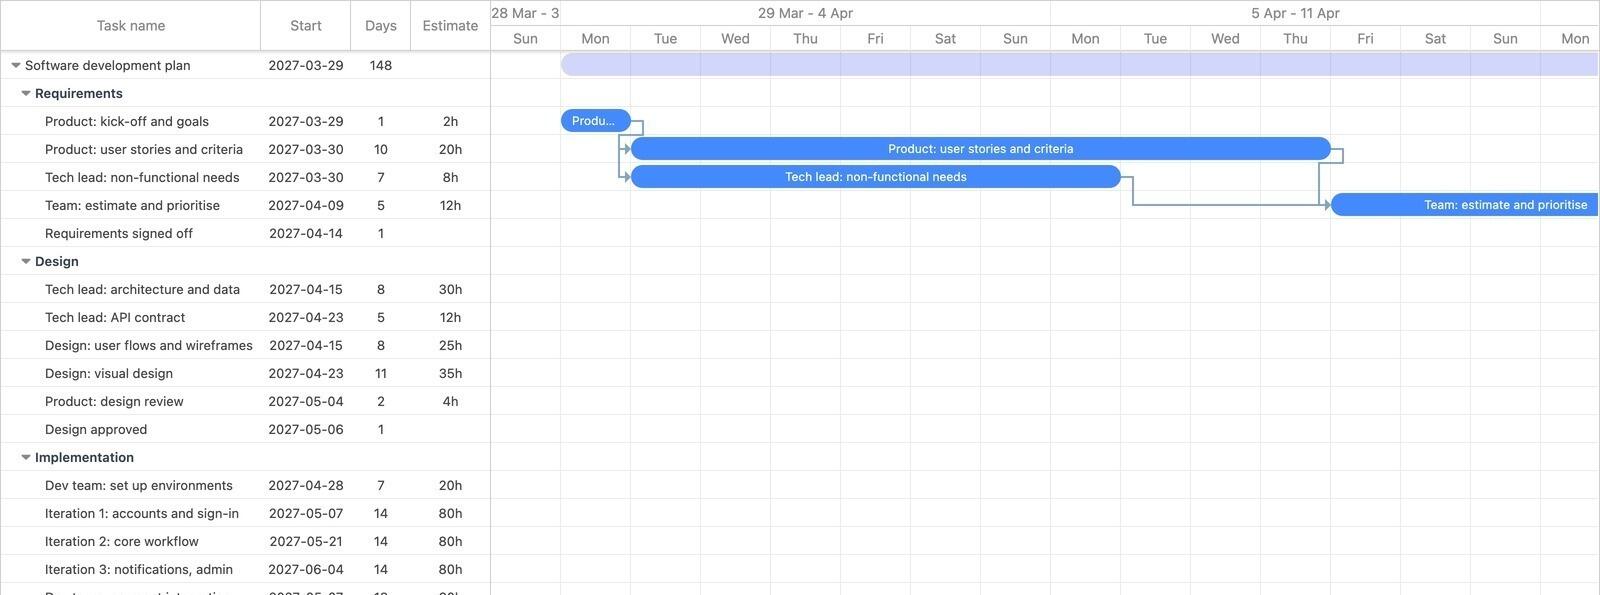
One project from requirements to the maintenance handoff. Implementation is drawn as three two-week iterations rather than a list of tickets, because the tickets belong in an issue tracker. Testing runs alongside the build, and acceptance testing sits between the release candidate and go-live. The change request row is a worked example of scope growth: it arrived after sign-off and pushed every later date back by a week. The plan page shows how to revise the dates.
Multi-project roadmap
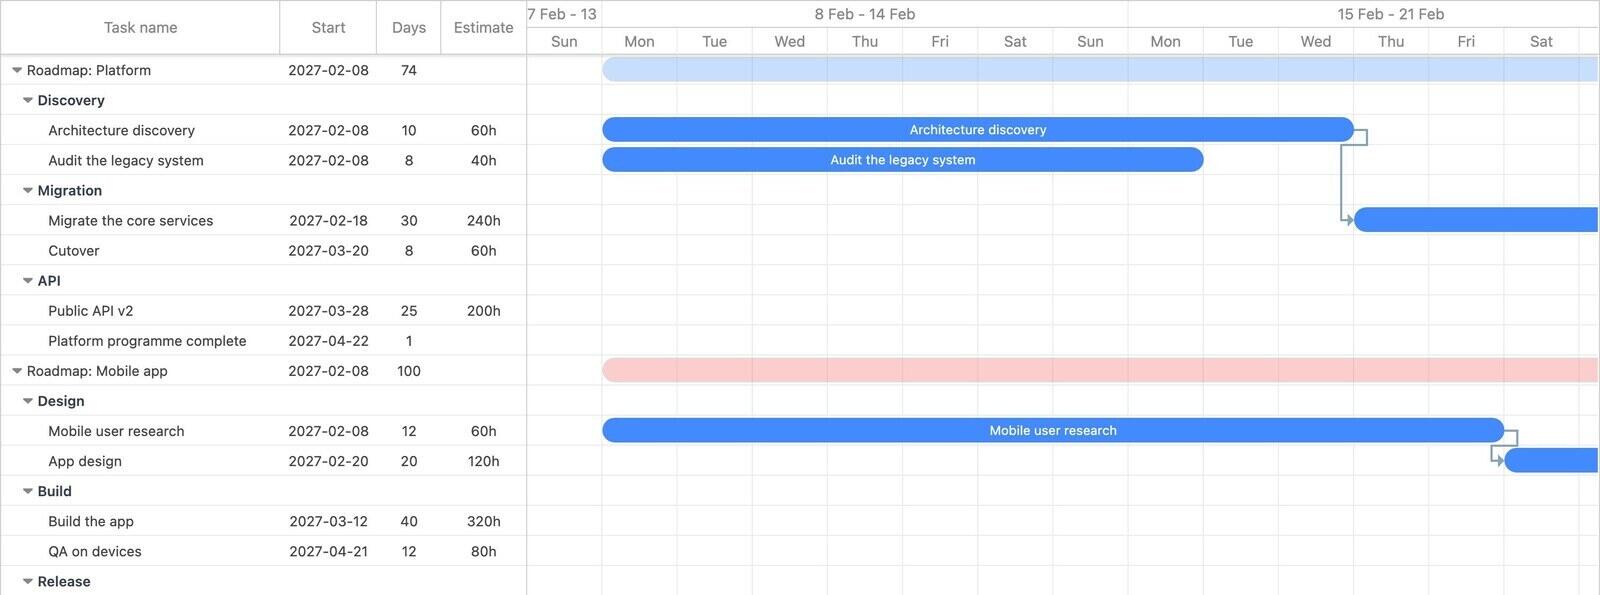
Three programmes on one chart, each a separate project with its own phases and completion milestone. The point is collisions: the platform cutover and the mobile build land in the same weeks, which matters if they need the same people. It also shows that the mobile programme, not platform, is what ends the quarter. Copying it opens all three projects together.
Which example shows the critical path most clearly?
A small chart built to teach one idea rather than to run a project from.
Critical path example
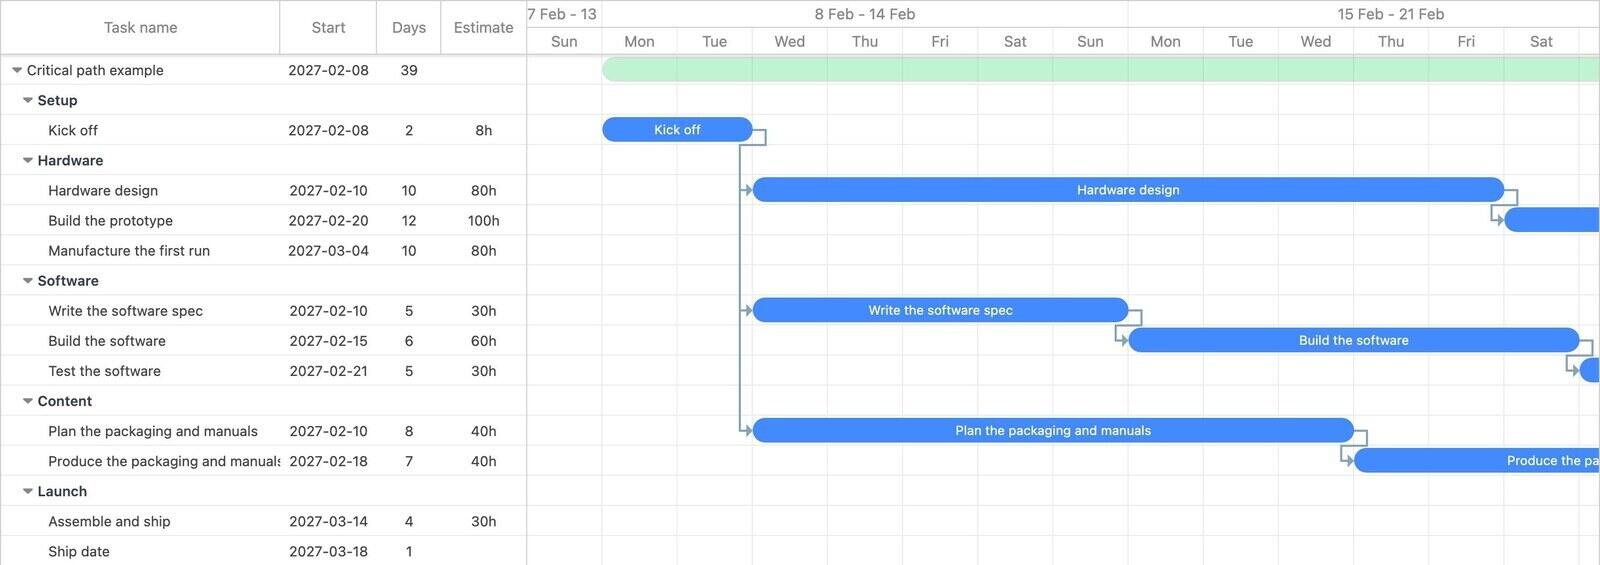
Three parallel tracks of very different lengths meet at one ship date. Hardware takes 32 days and decides the deadline; software and content finish more than two weeks early and could slip that far without changing anything. After copying it, turn on Critical path under Settings and the controlling chain is highlighted. The critical path explained goes further.
How do you pick an example and make it yours?
Pick by the shape of the work rather than the industry label. A plan that works back from a fixed date looks like the campaign, launch or event examples whatever you are actually launching. A plan held up by approvals you do not control looks like the construction or research examples. A team's week looks like the weekly plan, and an update for people outside the project looks like the timeline.
- Open the preview first. Check that the phases and the links between them match how your work really flows, not just that the names sound right.
- Copy it and set the fixed date first. Put your launch, event or deadline in place, then see whether the work before it fits. If it does not, better to find out now.
- Rename before you add. Change the tasks you recognise, delete the ones you do not need, and only then add rows of your own.
- Link dependent tasks. Only link tasks that genuinely wait for each other. Deciding what to link covers the usual mistakes.
If none of the twelve is close, the full template list has short descriptions of each, and the simple chart is the quickest one to rebuild into something else.
Common questions
Can I open these examples without an account?
Yes. See template in action opens a read-only copy of the chart in the browser, no account needed. Use template needs a free Ganttile account, and the copy starts on the coming Monday with every gap and link kept.
 Breeze
 Timen
Timen


