- Templates |
- Project Schedule
Project schedule template
Five phases, twenty-four tasks and thirty dependencies from initiation to closure. Open the schedule, adapt the workstreams and use the linked tasks to explore how a delay affects the finish date.
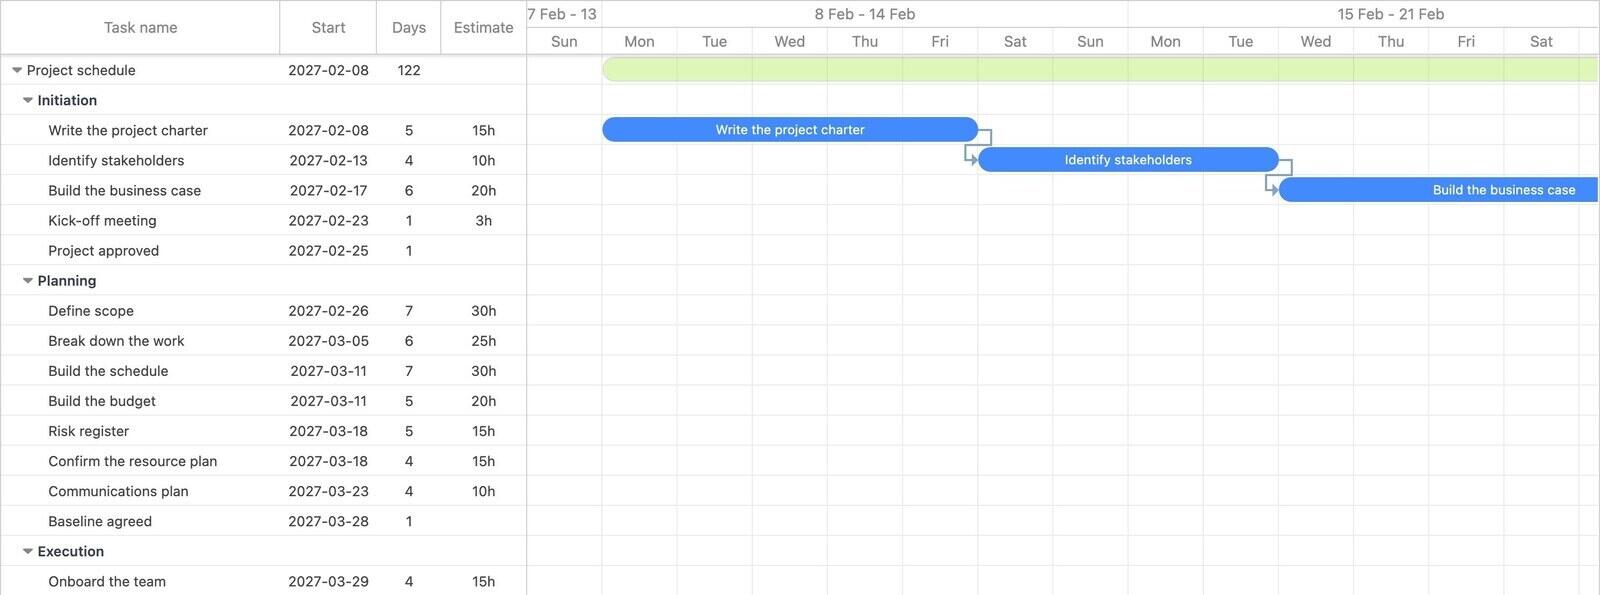
- 5 phases
- 24 tasks
- 4 milestones
- 30 dependencies
- About 4 months
What is in this template?
| Phase | What it covers |
|---|---|
| Initiation | Charter, stakeholders, business case and kick-off, ending on Project approved. |
| Planning | Scope, work breakdown, schedule and budget in parallel, then risk, resources and communications. Ends on Baseline agreed. |
| Execution | Team onboarding, two parallel workstreams, then integration and Build complete. |
| Monitoring and control | Weekly reporting and change control as long bars running alongside execution, plus the quality and risk reviews at the end. |
| Closure | UAT, fixes, handover documentation, training, lessons learned and Project closed. |
How the schedule connects the work
This template combines dates with dependencies, so you can see which activities need an earlier task to finish. Its two workstreams converge on integration, followed by testing and handover. A higher-level project timeline template may be easier to use for a milestone update.
Check each link as you adapt the plan. A finish-to-start dependency means the successor waits for the predecessor to finish; it does not mean every task needs to be linked to the one above it.
- Approvals: keep decision milestones where work genuinely needs permission to proceed.
- Parallel work: overlap activities when their inputs and available people allow it. A shared phase does not necessarily mean its tasks can all start together.
- Integration: link work that combines several outputs to every input it requires.
- Monitoring: keep reporting and change control alongside delivery. Add approval gates where your process requires them.
Where float fits into the schedule
Total float is the time a task can move without delaying the project finish, given the current schedule. Free float is the time it can move without delaying its immediate successor. A visible gap between bars is not always the same as total float.
Look at where the two workstreams join. If one finishes earlier, it may have room to move before integration needs it. How much room depends on all the relevant links, dates and constraints, so check the edited chart rather than assuming a fixed two-week allowance.
A buffer is different: it is time deliberately allowed for uncertainty. Make those allowances visible and explain what they cover when agreeing the schedule.
Finding the critical path
Turn on critical path highlighting to see which linked activities determine the finish date. Review the result after changing durations or dependencies: another workstream can become critical, and more than one path can be critical at once.
A task outside the current critical path can still delay the project if a slip uses up its available float. The critical path example gives you a smaller chart for exploring that relationship.
What to check when a task slips
Try a delay on a copy of the plan with automatic scheduling set as intended. Compare these cases:
- A task on the critical path: a delay may move the finish date unless you recover time elsewhere.
- The earlier-finishing workstream: some delay may fit before integration, depending on available float and scheduling settings.
- A planning activity: check whether the approval milestone actually needs its output, and which other tasks it blocks.
Review the affected people and commitments as well as the chart. Automatic scheduling applies the links you have entered; it cannot confirm that a revised assignment or delivery date is feasible.
Why the baseline milestone matters
Use Baseline agreed to mark approval of the scope and schedule. Save a baseline at that point so later dates can be compared with the agreed plan. Changes may cost time or money at any stage; after approval, record their effect and agree them through your change process.
Teams that skip this point tend to discover halfway through that nobody agrees what was promised. Putting it on the chart makes the moment explicit, and gives you something to point back to when the conversation comes up.
How do you adapt it?
Click Use template and a copy lands in your account with the whole schedule shifted to start on the coming Monday, gaps and links intact. Then rename the two workstreams to whatever your project actually splits into, set real durations, and delete any governance tasks your organisation does not use. Keep the dependencies as they are until the durations are right, then look at the critical path and ask whether it is the chain you expected. If it is not, that is usually the most useful thing the template will tell you.
If this feels heavier than you need, the project timeline template is the same idea with far fewer rows, and the simple Gantt chart is the smallest version.
Common questions
What is the difference between a project schedule and a project timeline?
This schedule includes detailed tasks and dependencies for planning the work. The project timeline template offers a higher-level view for communicating milestones. Choose the level of detail your audience needs.
How do I find the critical path in this template?
Open the chart and enable critical path highlighting. Review it after changing durations or dependencies, because the activities that determine the finish date can change.
What is float, and how do I see it?
Total float is how long a task can move without delaying the project finish. It depends on the full schedule, not just the visible gap before the next task. Review the links and critical path after editing the template.
Can I add my own phases?
Yes. Once the schedule is in your account each phase is an ordinary group you can rename, reorder, delete or add to.
 Breeze
 Timen
Timen


