- Templates |
- Project Timeline
Project timeline template
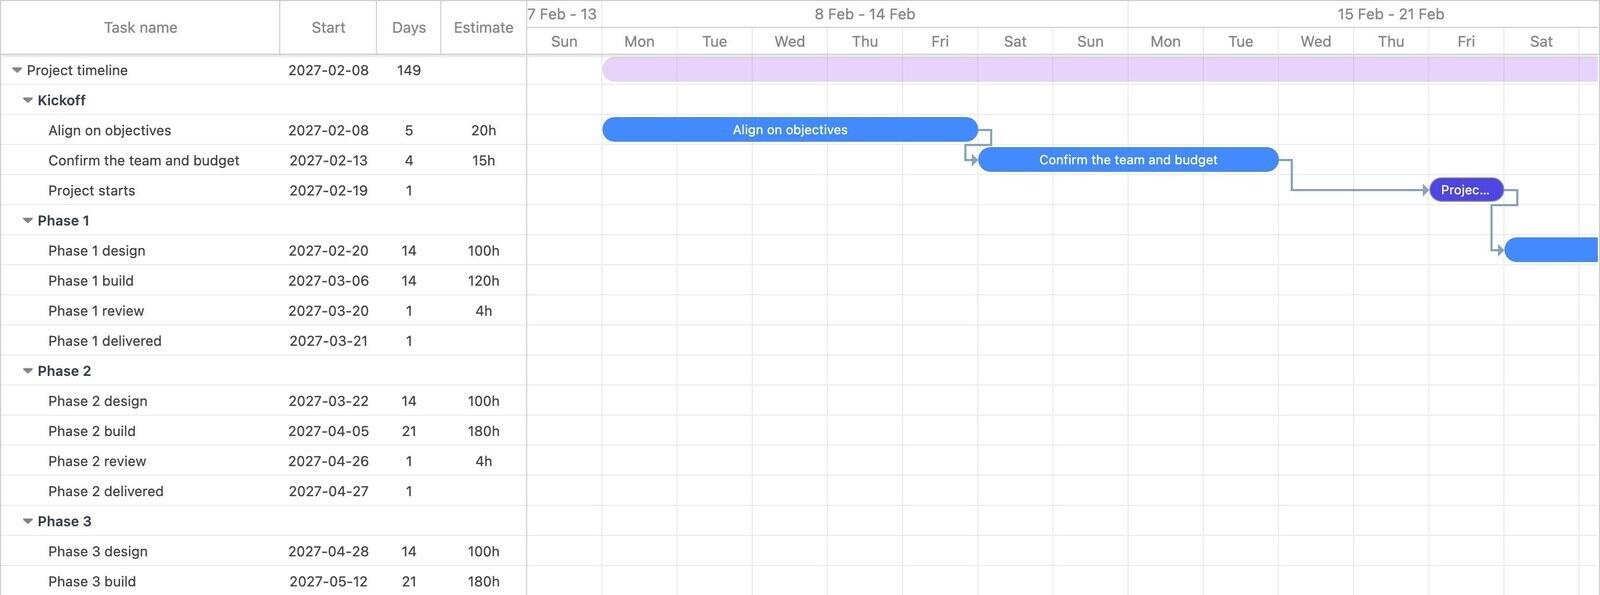
A timeline is what you show people who are not doing the work. This template is built for that job: three delivery phases, long bars instead of task-level detail, and six milestones so anyone can see at a glance where the project is and what the next checkpoint is.
- 5 phases
- 15 tasks
- 6 milestones
- 20 dependencies
- About 5 months
What is in this template?
| Phase | What it covers |
|---|---|
| Kickoff | Objectives, team and budget, closing on Project starts. The only place discovery appears on a timeline. |
| Phase 1 | Design, build and review, ending on Phase 1 delivered. |
| Phase 2 | The same shape, longer. Ends on Phase 2 delivered. |
| Phase 3 | Design, build and review, ending on Phase 3 delivered. |
| Delivery | End-to-end testing, stakeholder review, Signed off, rollout, handover and Project delivered. |
Timeline or schedule?
These are two different documents and it is worth being deliberate about which one you are making.
A schedule is a working document. It has every task, real durations and a dense web of links, and it changes constantly. A timeline is a communication document. It has one bar per phase, a clear set of milestones, and it changes when something meaningful happens.
Trying to make one document do both is the usual mistake: the schedule becomes too coarse to run the work from and the timeline becomes too noisy for anyone to read. If you want the working version instead, take the project schedule template.
Getting the milestones right
Six milestones over five months is about the right density: roughly one a month, each marking something a stakeholder would recognise as progress. Each phase ends with a short review task followed by a milestone, which is what makes the delivered dates real rather than optimistic — someone has to look at the work before the marker is earned.
How do you adapt it?
Click Use template, and the whole timeline shifts to start on the coming Monday with the spacing intact. Then rename the three phases to your actual workstreams and stretch the bars to your real dates. Resist adding task detail — the moment this chart needs scrolling, it has stopped doing its job.
Common questions
What is the difference between a timeline and a schedule?
A timeline answers "where are we and what is next" in one screen. A schedule answers "what does everyone do on Tuesday". This template is the first kind.
How many milestones should a timeline have?
Enough that every month has one, and few enough that each means something. If every second row is a milestone they stop being checkpoints and become decoration.
Can I use it for a status report?
That is what it is for. Export the chart as an image or a PDF, or share a read-only link so people see the current version rather than the one from the last meeting.
What if my project does not have three phases?
Add or remove phases once the copy is in your account. Three is just the most common shape.
 Breeze
 Timen
Timen


