What is a Gantt chart?
A Gantt chart is a type of bar chart that shows a project schedule. Each task is a horizontal bar on a timeline - the bar's position shows when the task starts, and its length shows how long it runs. That makes it easy to see the full picture of a project at a glance.
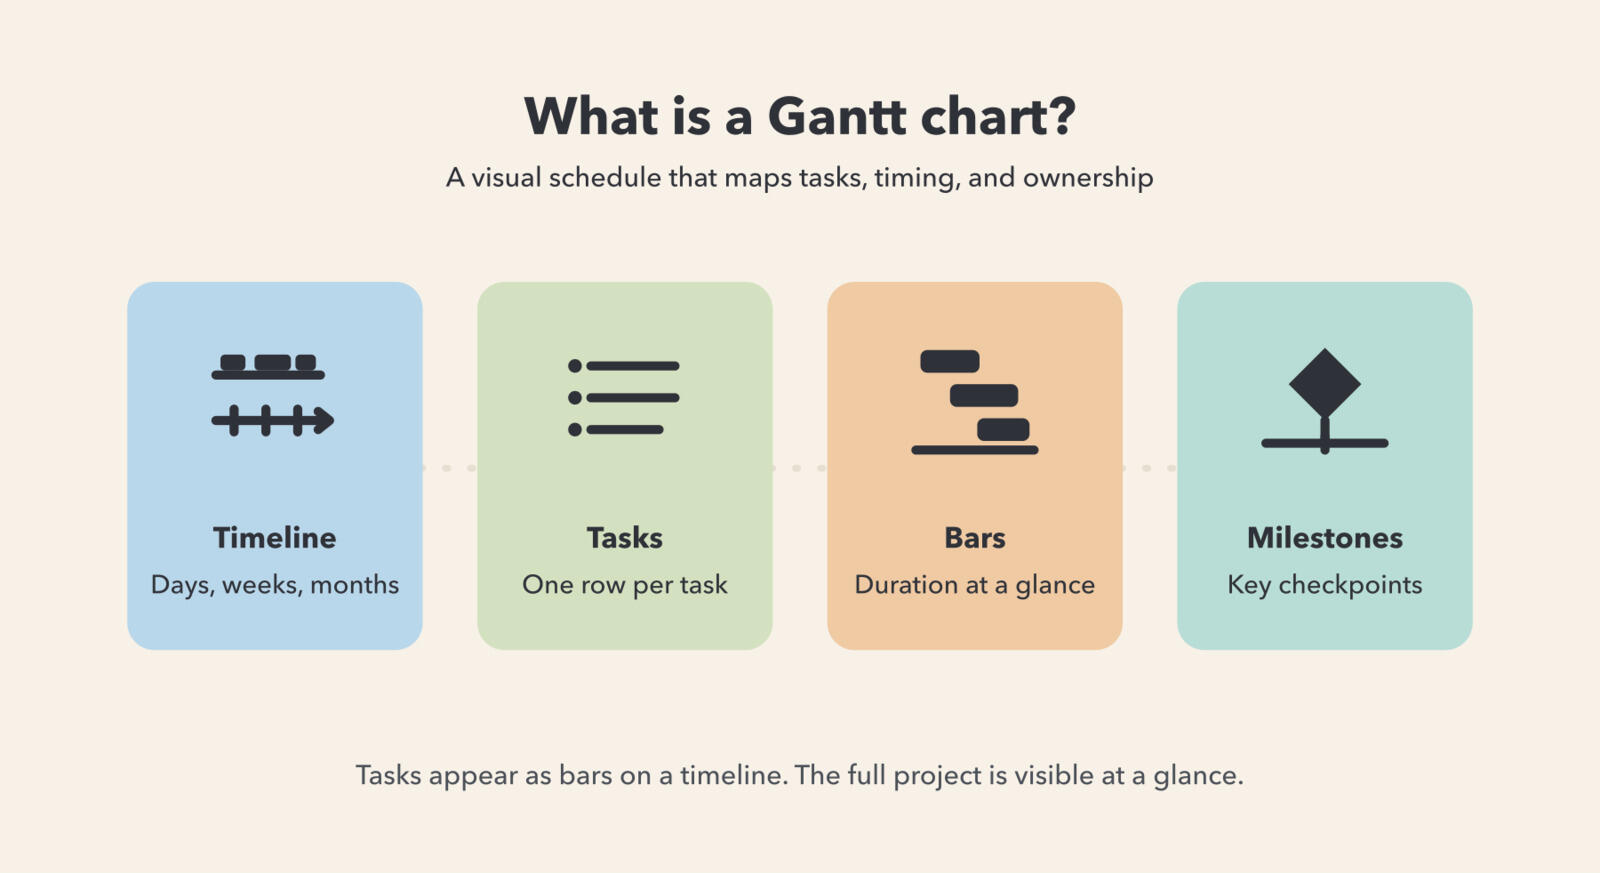
1. What is a Gantt chart?
A Gantt chart is a visual tool that maps project tasks onto a calendar. The horizontal axis is time - days, weeks, or months - and each row represents one task. A bar stretches from the task's start date to its end date, so you can immediately see how long it takes and when it fits relative to everything else.
The chart takes its name from Henry Gantt, an American engineer who developed the format in the early 1900s as a simpler way to communicate project schedules. More than a century later, the core idea is exactly the same: show the work clearly on a timeline so anyone can understand the plan without needing an explanation.
2. What are the main parts of a Gantt chart?
Most Gantt charts share the same basic elements. Once you know what each part does, any chart becomes easy to read.
- Tasks - the individual pieces of work. Each task gets its own row on the chart.
- Timeline - the horizontal axis. It can be measured in days, weeks, or months depending on the length of the project.
- Bars - the colored bars that show when each task runs. The length of the bar equals the duration of the task.
- Milestones - key dates or checkpoints, usually shown as a diamond symbol. They mark important moments like a review, a delivery, or a launch date.
- Dependencies - arrows or lines that connect tasks which must happen in a certain order. A dependency tells you that one task cannot start until another one is finished.
- Owners - most Gantt tools let you assign each task to a person or team, so it is always clear who is responsible.
Some charts also show percentage complete on each bar, so you can see at a glance how far along a task is without having to ask.
3. A simple Gantt chart example
Here is a basic Gantt chart for a four-week website launch. Each row is a task, and the shaded cells show when that task is active.
| Task | Week 1 | Week 2 | Week 3 | Week 4 |
|---|---|---|---|---|
| Define goals and scope | ███ | |||
| Design mockups | ███ | |||
| Build pages | ███ | |||
| Review and test | ██ | |||
| Launch ◆ | ◆ |
Even this small chart shows something useful: the tasks run one after another with no overlap, and the launch milestone sits at the end of week four. In a real project you would also see which tasks depend on each other and who owns each one.

4. When does a Gantt chart help most?
A Gantt chart helps most when tasks overlap, the order matters, and more than one person is involved. If your project has a fixed end date and you need everyone to know what they are doing and when, a Gantt chart is one of the clearest ways to communicate that.
It works well for projects like:
- Website or product launches - where design, development, and review run in a fixed sequence.
- Event planning - where venue, catering, invitations, and logistics each have their own deadlines.
- Construction or renovation - where one phase must finish before the next can begin.
- Software releases - where features, testing, and deployment follow a set schedule.
In all of these, the chart gives the team a shared view of the plan so they can spot conflicts, prepare for handoffs, and stay on track without needing constant check-ins.
5. When is a Gantt chart not the right fit?
A Gantt chart is less useful when the work is exploratory, changes often, or does not follow a fixed sequence. If tasks are added and removed daily or priorities shift every week, keeping a chart updated can take more effort than it saves.
For simple, short work owned by one person, a plain task list is usually enough. For ongoing work without a fixed end date - like handling support tickets or running a content calendar - a Kanban board often fits better because it focuses on flow rather than schedule.
When a project does have a clear timeline and dependencies, that is where a dedicated Gantt tool like Ganttile earns its place. It handles the scheduling and lets you focus on the work instead of maintaining a spreadsheet manually.
6. How do you create your first Gantt chart?
Creating a Gantt chart does not require much preparation. The process is straightforward once you have a basic list of tasks and rough estimates for how long each one takes.
- List all the tasks in your project from start to finish.
- Estimate how long each task will take - even a rough estimate is better than none.
- Identify dependencies - note which tasks cannot start until another one is done.
- Set start and end dates for each task based on your estimates and constraints.
- Assign an owner to each task so it is clear who is responsible.
- Share the chart with your team and update it as the project progresses.
You can start in a spreadsheet, but a dedicated tool makes it much faster to adjust dates, visualize dependencies, and share updates. Ganttile is built for exactly this - it is simple enough to set up in minutes and keeps the chart easy to maintain as things change.
Common questions about Gantt charts
- What is the difference between a Gantt chart and a project timeline?
- A project timeline is a general term for any visualization of project events over time. A Gantt chart is a specific type of timeline that shows tasks as bars with defined start and end dates, making overlaps and dependencies easy to read at a glance.
- Is a Gantt chart the same as a bar chart?
- A Gantt chart uses bars, but the bars represent time spans for tasks rather than quantities. The position of each bar shows when the task starts, and the length shows how long it runs.
- Can a Gantt chart show who is responsible for each task?
- Yes. Most Gantt tools let you assign each task to a person or team, so it is always clear who owns what and where workloads might overlap.
- Do you need software to make a Gantt chart?
- You can create a basic Gantt chart in a spreadsheet, but dedicated tools like Ganttile make it faster to set dates, add dependencies, and keep the chart accurate as the project changes.
Next steps
If your project has more than a few tasks and more than one person involved, a Gantt chart is worth trying. The structure it adds - clear task order, shared timelines, visible ownership - removes a lot of the back-and-forth that slows teams down.
 Timen
Timen

