- Templates |
- Multi-project Roadmap
Multi-project roadmap template
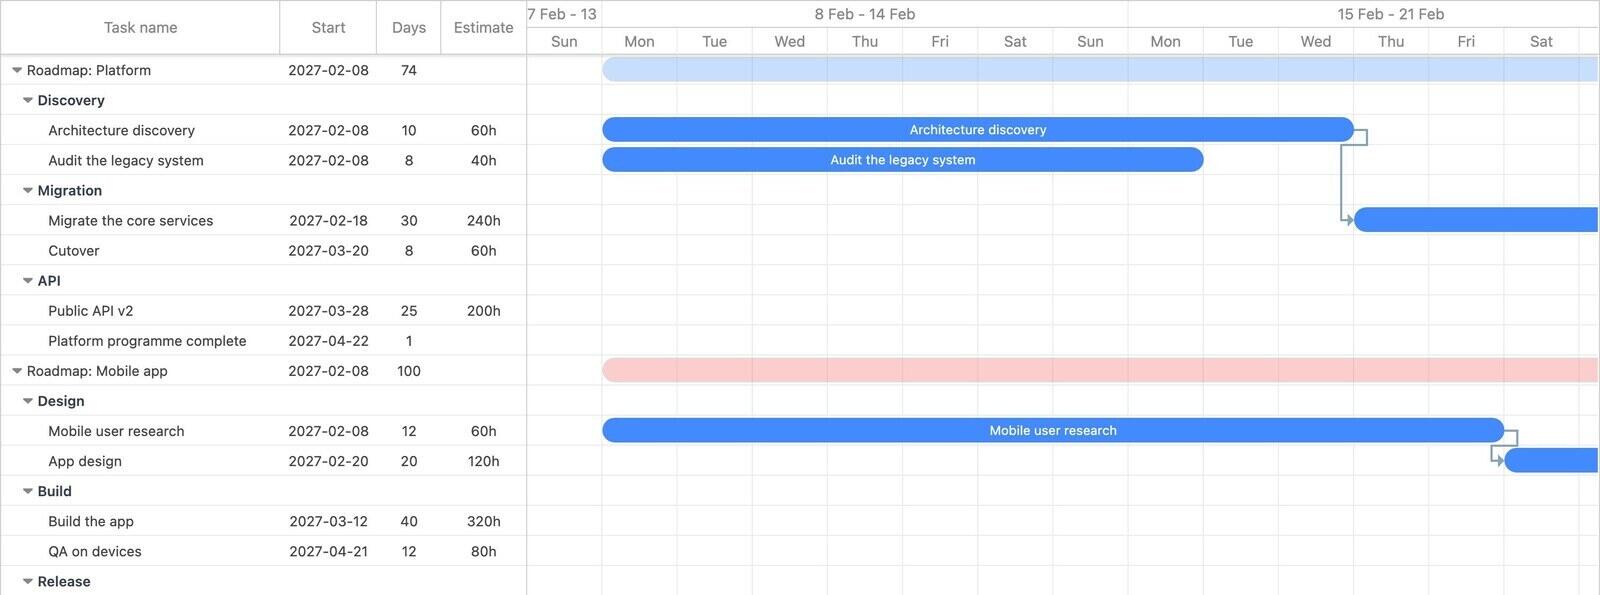
Three programmes on one chart. This is the template for the case where the question is not "when does this project finish" but "what is everyone doing over the next quarter, and where do the two collide". Copying it creates three separate projects and opens them together.
- 3 projects
- 9 phases
- 15 tasks
- 3 milestones
- About 3.5 months
What is in this template?
| Programme | Phases | Length |
|---|---|---|
| Platform | Discovery, Migration, API | 74 days |
| Mobile app | Design, Build, Release | 100 days |
| Data | Foundations, Pipelines, Reporting | 96 days |
Each is a real project with its own phases, dependencies and completion milestone. On the chart they appear as three collapsible groups, so you can fold two away and look at one, or open all three and see the quarter at once.
Why one chart rather than three
The value of putting programmes side by side is not tidiness, it is collision detection. Three things become visible immediately that are invisible when each project has its own chart:
- Where the peaks overlap. The platform cutover and the mobile build land in the same weeks. If those need the same people, you have found that out in advance.
- Which programme actually ends the quarter. Mobile runs longest here, so it, not platform, is what determines when the whole roadmap is done.
- Where the quiet periods are. Useful when someone asks whether a fourth thing can be squeezed in.
Dependencies across programmes
Within a project, tasks link normally. Across projects, the practical approach is a milestone in each: the receiving programme gets a milestone for whatever it is waiting on, and you move it when the other one lands.
It is less automatic than a direct link, but it is more honest — cross-programme dependencies are usually negotiated rather than mechanical, and a milestone is a thing two teams can agree on.
How do you adapt it?
Click Use template and all three projects are copied into your account and opened together on one chart. All three start on the coming Monday, because each project is re-dated independently when it is copied. Drag the programmes to build the stagger you actually have — most roadmaps do not start everything at once.
Then rename the three to your real programmes. You can add more projects to the same view at any time from the project selector in the toolbar; nothing about this template limits it to three.
Common questions
Can one Gantt chart show several projects?
Yes. Ganttile renders any number of projects on one chart, each as its own collapsible group. You choose which appear from the toolbar selector.
How many projects does this template create?
Three. Using the template copies all three into your account at once and opens them together.
Can tasks in one project depend on tasks in another?
Within a project, yes. Across projects, use a milestone in the receiving project for what it is waiting on.
Why do all three programmes start on the same day?
So the copy lands cleanly — each project is re-dated to the coming Monday. Drag any programme later to build your real stagger.
 Breeze
 Timen
Timen


