How to create a Gantt chart
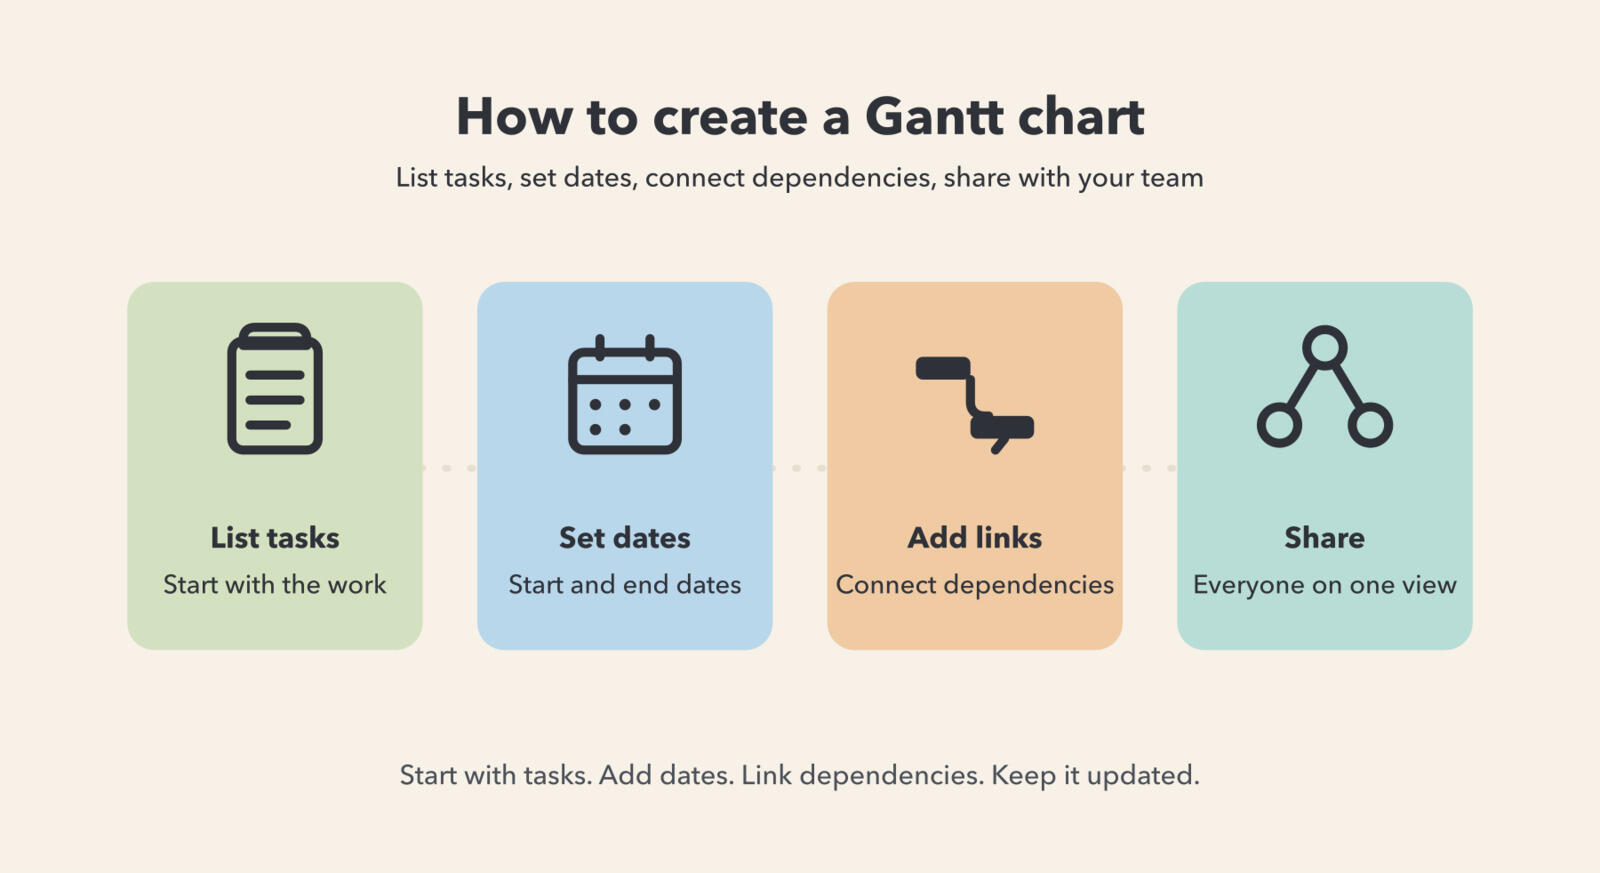
Creating a Gantt chart takes five steps: list your tasks, estimate how long each one takes, identify which tasks depend on others, set start and end dates, and assign owners. Once those pieces are in place, the chart gives everyone on the project a shared view of what needs to happen and when.
1. What do you need before you start building a Gantt chart?
Before you open a tool, you need three things: a list of the work to be done, a rough sense of how long each piece takes, and a fixed end date or deadline to plan toward. Without these, any chart you build will be guesswork dressed up as a schedule.
You do not need perfect estimates. A Gantt chart is a planning tool, not a contract. Rough durations - a few days here, a week there - are enough to get started. You can refine them as the project moves forward.
If you are unsure what a Gantt chart is or whether it fits your project, it is worth reading up first.
2. How do you list and sequence your tasks?
List every piece of work the project requires, then put it in the order it needs to happen. Do not group tasks yet - just get them out. A rough dump of everything is more useful at this stage than a tidy but incomplete list.
Once you have your list, look for natural groupings and sequences. Some tasks will clearly come before others. Some can run in parallel. Mark the ones that block other work - those are your most important scheduling constraints.
A simple website launch might produce a list like this:
- Define goals and scope
- Write content
- Design mockups
- Build pages
- Review and test
- Go live
The sequence is obvious here - you cannot build pages before you have designs, and you cannot go live before testing. That order becomes the backbone of your chart.
3. How do you set dates and durations?
Start from your end date and work backward, or start from today and work forward - whichever fits your situation better. Assign a start and end date to each task based on your duration estimates and the dependencies you have identified.
Leave some buffer. Real projects get interrupted, reviews take longer than expected, and people have other work to do. A chart with zero slack almost always slips on the first week.
Here is the full build process end to end:
- List all tasks in the order they need to happen.
- Estimate each task's duration - in days or weeks, not hours.
- Note which tasks depend on others - write down what must finish before each task can start.
- Set a start date for the project and work through the task list from there.
- Enter tasks into your Gantt chart tool with their start and end dates.
- Connect dependencies so the chart reflects the real order of work.
- Assign an owner to each task.
- Share the chart with everyone involved and update it as things change.
4. How do you add dependencies between tasks?
A dependency tells your chart that one task cannot start until another is done. In most tools, you draw a line or arrow from the first task to the second. The chart then adjusts dates automatically if the first task moves.
Focus on the most important dependencies first - the ones that would cause real problems if ignored. Not every task needs to be linked. A chart full of dependency arrows quickly becomes hard to read and harder to update.
For a deeper look at how task dependencies work and when to use each type, see the four standard ones.
6. How do you keep a Gantt chart up to date?
A Gantt chart is only useful if it reflects reality. The main reason charts stop being used is that updates feel like extra work on top of the actual work. The fix is to make updates part of the workflow, not separate from it.
A few habits that help:
- Update the chart when the work changes - not at the end of the week, but when a task slips, finishes early, or changes scope.
- Review the chart briefly at the start of each week - a five-minute check is enough to catch problems before they compound.
- Keep the task list short - a chart with 10 well-defined tasks is easier to maintain than one with 50 vague ones.
If the chart is getting stale, the most common cause is tasks that are too granular. Merge small tasks into larger ones and see if the update burden drops.

Common questions about creating a Gantt chart
- How long does it take to create a Gantt chart?
- For a simple project with 10 to 20 tasks, building a basic Gantt chart takes 30 to 60 minutes. Most of that time is thinking through the task list and dependencies, not entering data into the tool.
- What is the first step in creating a Gantt chart?
- The first step is listing all the tasks your project requires. Get the full list out before you worry about dates, tools, or order. An incomplete task list is the most common reason a Gantt chart breaks down in the first week.
- How detailed should a Gantt chart be?
- As detailed as it needs to be to answer two questions: what is happening this week, and is anything at risk? If your chart can answer those, it is detailed enough. If tasks are so small that updating them takes longer than doing them, you have gone too far.
- Can one person own multiple tasks in a Gantt chart?
- Yes, and in most projects that is normal. What matters is that each task has exactly one owner. Multiple owners on a single task usually means nobody feels fully responsible for updating it.
Next steps
The best way to learn how to create a Gantt chart is to build one for a real project you are working on now. Start with a rough task list, set approximate dates, and connect the most obvious dependencies.
 Timen
Timen

