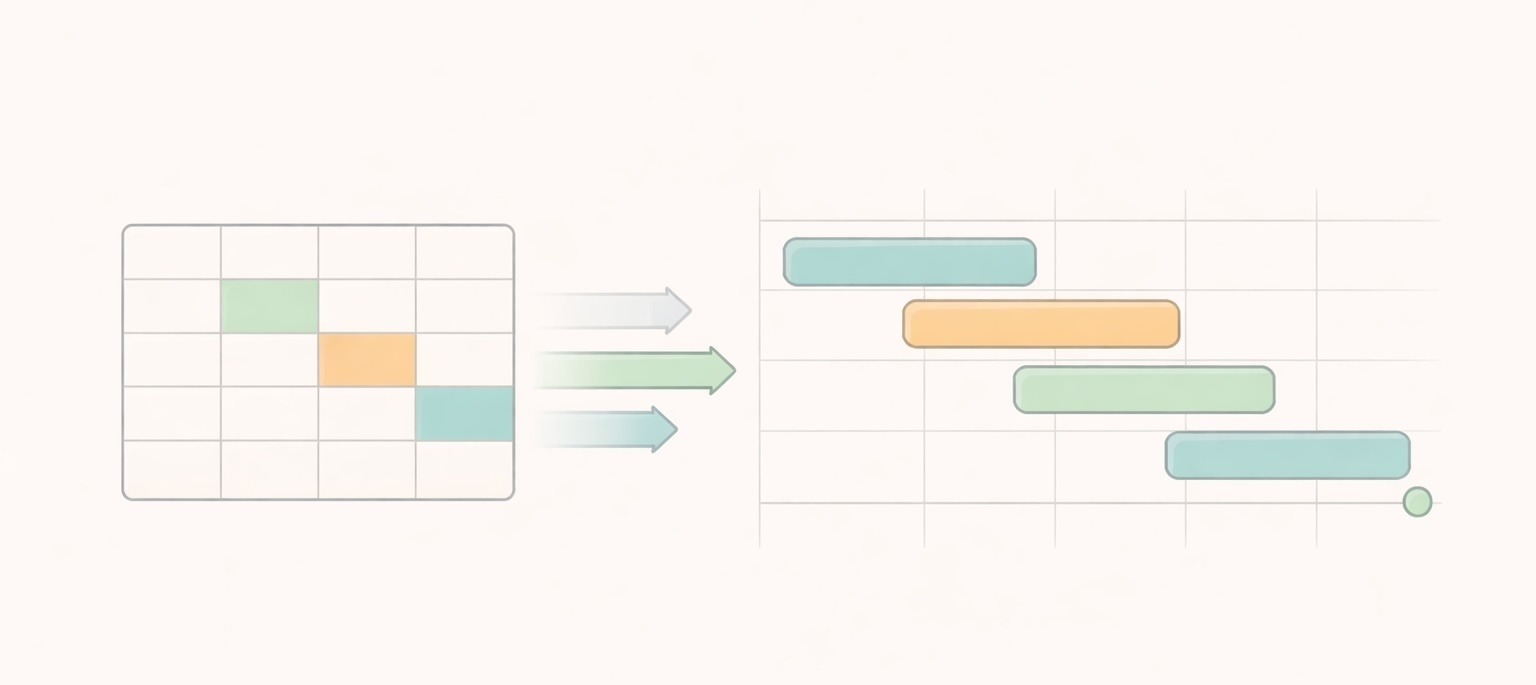
Gantt chart vs spreadsheet
A spreadsheet is flexible, familiar, and useful for organizing project data, but it is mostly manual. A Gantt chart is a structured schedule built to show timing, overlap, and task relationships clearly. That makes spreadsheets better for raw planning lists and Gantt charts better for managing the schedule itself.
1. What is the difference between a spreadsheet and a Gantt chart?
A spreadsheet is a general-purpose grid. It can hold task names, due dates, owners, notes, and formulas, but it does not naturally show how the schedule fits together. A Gantt chart is purpose-built for time-based planning, so it shows each task as a bar on a timeline instead of leaving you to infer the schedule from cells.
That difference matters because people read visuals faster than tables. In a spreadsheet, you usually have to scan multiple columns to understand what overlaps and what comes next. In a Gantt chart, the structure is visible immediately. If your current setup is still spreadsheet-heavy, building a chart without Excel often helps.
A spreadsheet is often closer to a database than a plan. It is good at storing details, sorting rows, and calculating values, but the schedule is something you mentally assemble from the data. A Gantt chart turns that same information into a planning view, so the timing is not hidden inside columns and formulas.
2. When does a spreadsheet work better?
A spreadsheet works better when the main job is storing and sorting information. It is useful for collecting project inputs, making rough estimates, building checklists, or tracking simple work where the schedule itself is not the hard part.
That includes solo planning, lightweight admin work, and projects where the task list matters more than sequencing. Excel and Google Sheets are also good when you need custom calculations, budget tracking, or a simple handoff file. Spreadsheets are flexible because they do not assume any one workflow.
The tradeoff is that you have to create the logic yourself. If you want a spreadsheet to behave like a schedule, you end up maintaining that structure manually.
That flexibility can be a real advantage early on. A team might start with a spreadsheet to estimate costs, capture requirements, or compare options before the actual project plan is stable. In that phase, the open-ended nature of a spreadsheet is helpful because you are still shaping the work rather than scheduling it precisely.
3. When does a Gantt chart work better?
A Gantt chart works better when the difficult part of the project is timing. If tasks overlap, block each other, or need to land before a fixed deadline, a Gantt chart makes those relationships visible in a way a spreadsheet usually does not.
This is especially useful for multi-person work. A spreadsheet might tell you that task B is due on June 12, but it will not naturally show that task B cannot start until task A is approved on June 8. A Gantt chart makes that dependency part of the schedule itself, and you can build that structure without overcomplicating it.
If your team keeps asking what is blocking what, a spreadsheet is probably no longer enough on its own.
A Gantt chart is also better when meetings are becoming translation exercises. If the project manager has to explain the spreadsheet line by line so everyone understands the plan, the format is no longer doing enough work on its own. A good chart reduces that explanation burden because the sequence and timing are already visible.
4. Spreadsheet vs Gantt chart: a direct comparison
Spreadsheets win on flexibility. Gantt charts win on schedule clarity. The better tool depends on whether you are organizing information or managing time and coordination.
| Option | Best for | Limitations | What changes when plans shift |
|---|---|---|---|
| Spreadsheet | Task lists, rough plans, budgets, estimates, and custom data tracking | Weak visual scheduling, no natural dependency logic, and more manual upkeep | You usually update rows, dates, formatting, and formulas yourself. |
| Gantt chart | Project scheduling, dependency planning, and shared deadline management | Less flexible for general data analysis and unnecessary for very simple work | The schedule is easier to adjust because timing is already visual and structured. |
The key difference is not whether one is simpler than the other. It is whether the team needs a data grid or a schedule view. Those are different needs, and the tools reflect that.
In practice, many projects start in a spreadsheet and later move into a Gantt chart. That is not a failure of the spreadsheet. It just reflects a change in the job the tool is being asked to do. Early on, the work may be about collecting information. Later, it becomes about coordinating a schedule across real deadlines and real people.
5. When should you move from a spreadsheet to a Gantt chart?
Move when the spreadsheet starts generating coordination problems. That usually happens when dates change often, multiple people depend on the same schedule, or the team has to scan rows manually to figure out what comes next.
A few clear signals are repeated copy-and-paste updates, conditional formatting that nobody wants to touch, and status meetings spent translating a table into a real schedule. At that point, the spreadsheet is still storing information, but it is no longer a good tool for explaining the plan. A Gantt chart makes the schedule readable again.
The move does not have to be dramatic. Usually you can keep the spreadsheet for inputs like budgets or long notes, while shifting only the schedule into a chart. That split works well because it lets each tool do the part it is actually good at instead of forcing one format to carry the whole project.

Common questions about Gantt chart vs spreadsheet
- Can a spreadsheet be used as a Gantt chart?
- Yes, but only with manual setup. You can simulate a Gantt chart in a spreadsheet using dates, colored cells, and formulas, but it is more fragile and harder to maintain than a dedicated chart.
- Is Google Sheets enough for project planning?
- Sometimes. Google Sheets is often enough for lightweight planning, task lists, and small projects. It becomes less effective when you need dependencies, overlapping schedules, or a clear shared timeline.
- When does a spreadsheet become too hard to manage?
- It becomes too hard to manage when updates require too much manual work and the team can no longer read the schedule at a glance. That usually happens when the project gets longer, more detailed, or more collaborative.
- Which is better for team collaboration?
- A Gantt chart is usually better for schedule collaboration because everyone can see the same timeline and task relationships quickly. A spreadsheet can still support collaboration, but the schedule is usually harder to interpret.
Next steps
Keep the spreadsheet if it is helping you organize inputs. Move to a Gantt chart when the real challenge becomes timing, coordination, and keeping the schedule understandable.
 Timen
Timen

